Creating a custom Analytics engine for my Hashnode blog
Started off with ethical hacking, but now I'm more of a developer. Grew up in the USA & UK. Currently at Western Carolina University.
View part 2 of this article here!
Introduction
So, Hashnode has some very nice analytics. I like how you can see how much time people spend on your articles. But one feature that I'd like to see is more location data collected, I want to know where my readers are coming from. Why? Previously, I misjudged potential revenue due to not realizing over 60% of my userbase resided in Myanmar and were only using my service for its free nature.
Initial ideas
Initially, my plan was to create a Hashnode widget with some JavaScript that would collect some user data and then send it off to a database, however, Hashnode seems to disallow Javascript, oddly.
Iframes, on the other hand, are allowed to execute JavaScript (I assume so that pages can still function). To save costs on hosting, I decided to use an HTML Repl, and a PocketBase instance hosted on linode for the database.
Development
After creating a blank website on replit, I used cdnjs to find the libraries I need. For the PocketBase connection, I used their provided SDK. For analyzing browser information, I will use the platform.js library.
<!-- pocketbase sdk -->
<script src="https://cdnjs.cloudflare.com/ajax/libs/pocketbase/0.8.0-rc1/pocketbase.umd.min.js" integrity="sha512-0NJSuVFhF9NPZ/UAp98rCmJTTLhvjYwn2Uu4HN5eXE3uYfT6xad6WV6XuTmoKMMnj43yPT+kEyaCix1/t+8Tkw==" crossorigin="anonymous" referrerpolicy="no-referrer"></script>
<!-- platform.js -->
<script src="https://cdnjs.cloudflare.com/ajax/libs/platform/1.3.6/platform.min.js" integrity="sha512-eYPrm8TgYWg3aa6tvSRZjN4v0Z9Qx69q3RhfSj+Mf89QqwOMqmwSlsVqfp4N8NVAcZe/YeUhh9x/nM2CAOp6cA==" crossorigin="anonymous" referrerpolicy="no-referrer"></script>
<!-- jquery -->
<script src='https://code.jquery.com/jquery.min/js'></script>
Now let's set up the collection in PocketBase. Once you have a PocketBase instance set up following their instructions (make sure you remember the admin user password), you can create a new collection for the data. I called mine basic_analytics. Make sure to add all the fields you need, mine looks like this:
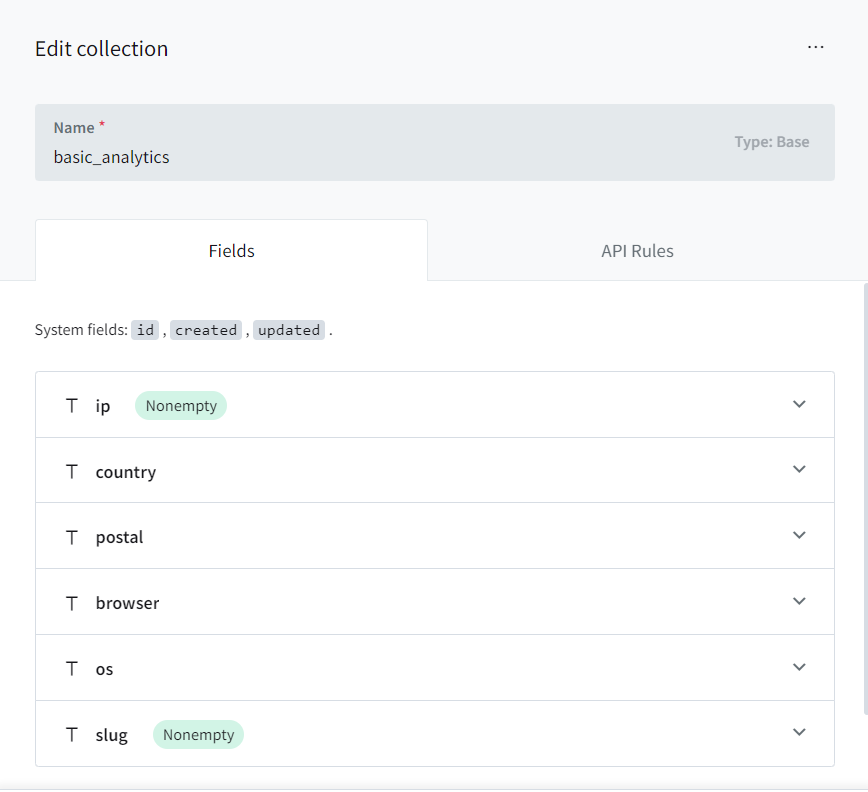
For security, I'm not going to do too much. You may want to make some changes, but I'm fairly new to PocketBase, and what I made works for me. In the API Rules, keep everything on admins only mode, but unlock the Create rule and leave it blank (allowing anyone to create new records). It should look like this:
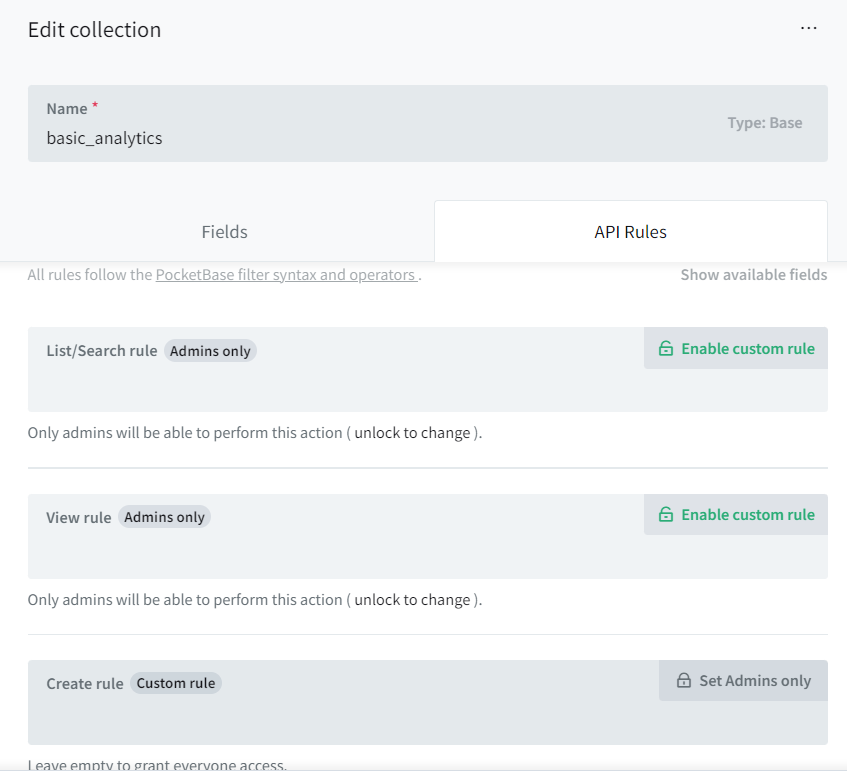
Everything not shown above has been left as the default.
JavaScript
Going back to your website, the HTML repl, let's create the connection to your PocketBase instance.
const pb = new PocketBase('https://<your pocketbase server>');
As we don't require authentication to create records, we don't need to worry about keys or anything.
Now let's add some JavaScript which will collect some analytics data, and add a new entry to our database. We will be using a URL parameter to let our script know which post we are collecting data for.
const agent = navigator.userAgent; // get userAgent string
var info = platform.parse(agent); // parse with platform.js
var params = new URLSearchParams(window.location.search); // get req params

// ipinfo is a free service to get ip and location
$.getJSON('https://ipinfo.io', (resp) => {
    var data = {
        'slug': params.get('slug'), // blog post slug

        'ip': resp.ip,
        'country': resp.country // country code
        'postal': resp.postal, // only the first couple characters

        'browser': info.name, // e.g., Chrome
        'os': info.os.family // e.g., Windows
    }

    // create record (basic_analytics is our collection name)
    let doc_p = pb.collection('basic_analytics').create(data);
    // log for debugging purposes
    console.log({
        doc_p,
        data
    });
})
Now, when we attempt to visit our website, we see a blank page, but a record is added to our database!
Collecting analytics
In order to collect analytics for your blog post, use the new "Insert HTML" feature when writing, and link to your website like so:
<iframe src='https://<repl-name>.<your-repl-username>.repl.co/?slug=post_slug_or_identifier'></iframe>
It's as simple as that!
Viewing analytics with Python
We could just log into our PocketBase instance every time we desired to view our analytics, but that's not fun. So let's write a simple Python script that authenticates with PocketBase as an admin and shows us a pretty table of analytics.
Before we start, we need to ensure these libraries are installed (with pip install library-name ):
pocketbase- python client for PocketBaserich- a library for pretty outputs (and creating a table in the console)
Now let's start writing. Create a new Python file, call it whatever you want. First, we need to import everything that we will use.
from argparse import ArgumentParser # to make a cli interface
from pocketbase import PocketBase # pocketbase client
from rich.table import Table # creating tables in the console
from getpass import getpass # get password input securely
from rich import print # pretty printing
Run the file to make sure everything is installed and working. Next, let's create the CLI.
parser = ArgumentParser() # new arg parser
parser.add_argument(
    '-s', '--slug', # name
    help='The slug of the blog post to get analytics for' # desc
)
parser.add_argument(
    '-p', '--password',
    help='The password to use to authenticate with the API'
)
args = parser.parse_args() # read args from command line args
Now we're ready to authenticate with PocketBase. We will add a fallback from the CLI that will prompt the user if a password was not given via argument.
pb = PocketBase('https://<your-pb-server>')
adminData = pb.admins.auth_with_password(
    '<admin-email-addr>',
    (args.password or getpass()) # use args, or fallback to prompt
)
pb.auth_store.save(adminData.token) # it took me 1 hour to figure this out
Now that we are authenticated as an admin, we can access all the "locked" methods for our PocketBase collection. Let's create our query parameters and get the results from our database.
query_params = {
    'per_page': 100 # up to 100 results returned
}
if args.slug: # if not given, will just return all posts' analytics
    query_params['filter'] = f'slug="{args.slug}"'

records = pb.collection('basic_analytics').get_full_list(query_params=query_params)
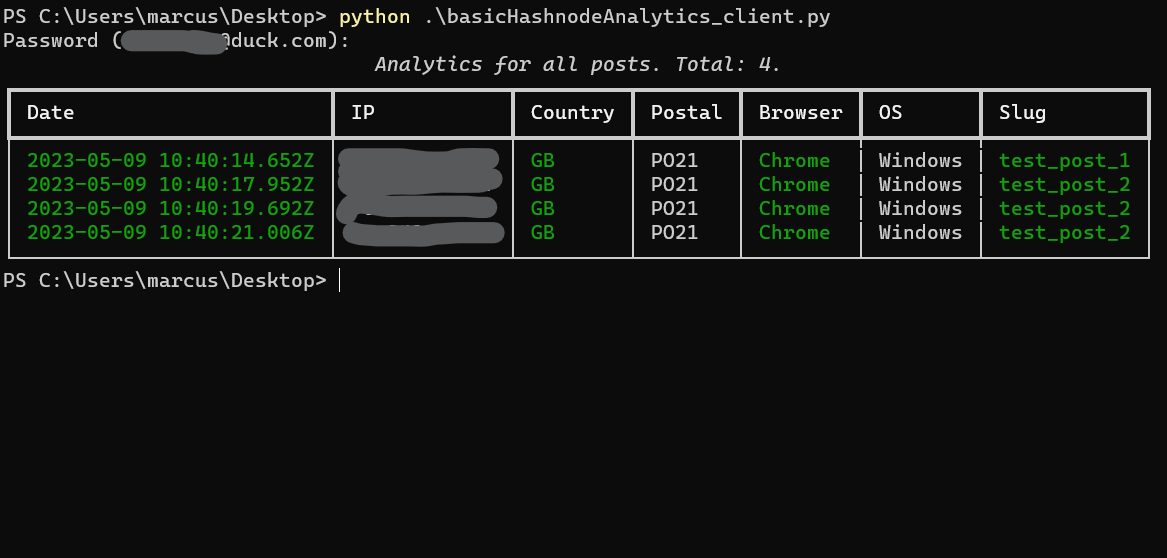
Now, using the rich library, let's show the results in a nice, readable way.
# create the table
table = Table(
title=f'Analytics for {args.slug or "all posts"}. Total: {len(records)}.'
)
table.add_column('Date')
table.add_column('IP')
table.add_column('Country')
table.add_column('Postal')
table.add_column('Browser')
table.add_column('OS')
if not args.slug:
table.add_column('Slug')
# populate
for record in records:
data = record.collection_id # contains entry data
row = [
f"[green]{data['created']}[/green]",
data['ip'],
f"[green]{data.get('country', 'Unknown')}[/green]",
data.get('postal', 'Unknown'),
f"[green]{data.get('browser', 'Unknown')}[/green]",
data.get('os', 'Unknown')
]
if not args.slug:
row.append(f"[green]{data['slug']}[/green]")
table.add_row(*row) # add row to table
# display table
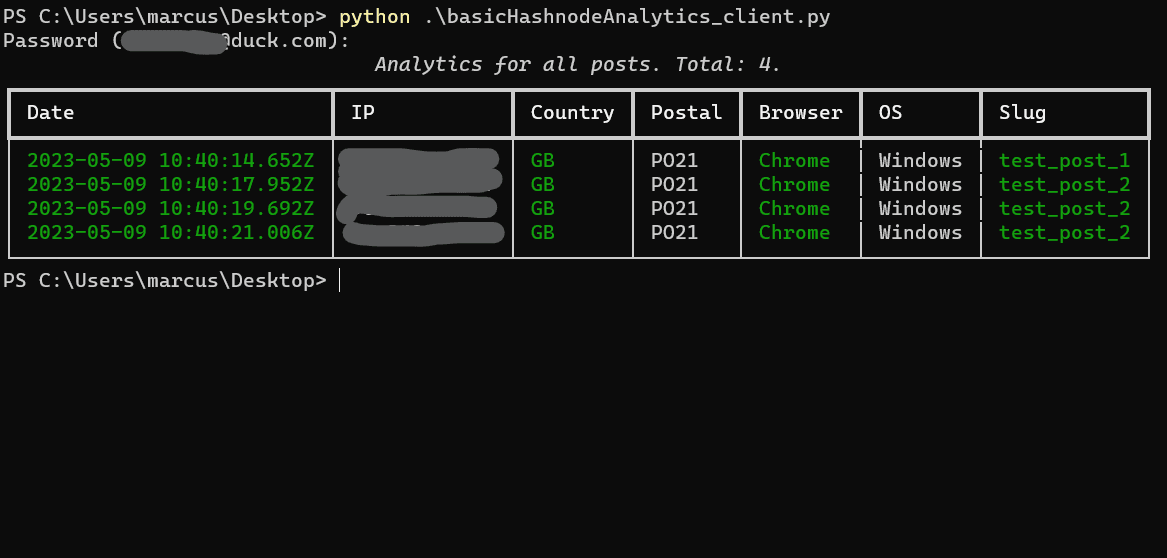
print(table) # remember, this print is imported from rich
I decided to add color to every other row to make the final result more readable.
Final thoughts
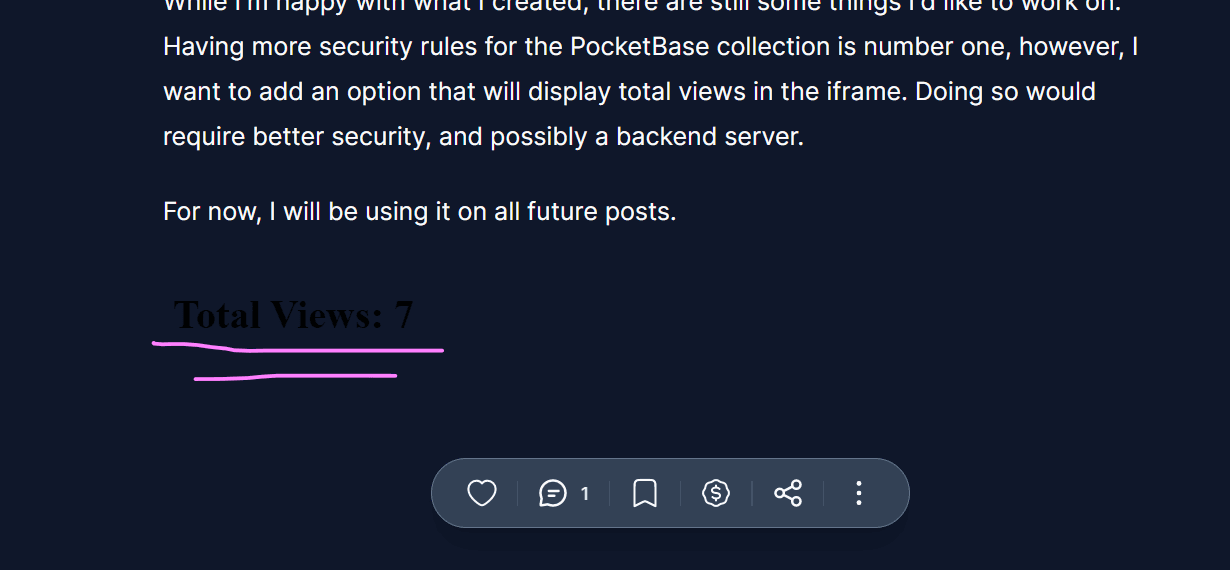
While I'm happy with what I created, there are still some things I'd like to work on. Having more security rules for the PocketBase collection is number one, however, I want to add an option that will display total views in the iframe. Doing so would require better security, and possibly a backend server.
For now, I will be using it on all future posts.